SUNY ESF
Nitrification and N Mineralization at Bartlett Experimental Forest

Introduction
During Summer 2010, we took pre-treatment measurements for an experiment exploring the effects of N and P fertilization on microbial N transformations in three mature northern hardwood stands in the Bartlett Experimental Forest, NH (C7, C8, and C9). Prior research investigating microbial responses to N and P additions in in situ incubation responses in soils from these sites suggests that microbial activity is N limited, or possibly co-limited by N and P. We sampled soils in stands in 2010 before any fertilization took place, and these same stands will be resampled after the plots are treated with N and P.
The objective of the 2010 measurements was to observe and document pre-treatment differences between plots (within-stand variability) and between stands in net N mineralization and net nitrification, as well as differences during the growing season. We can use this information to better understand any patterns that we observe after fertilization.
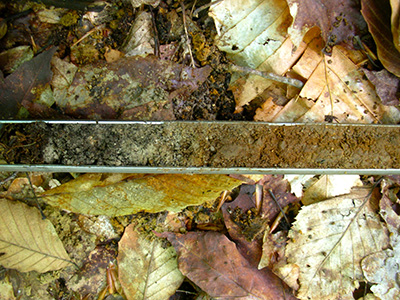
Figure 1. A soil core showing (from left to right): the Oie layer (leafy material), Oa layer (dark brown), E horizon (gray), and mineral B layer (light brown).
Methods
Soils were collected from four plots in three mature stands at the Bartlett Experimental Forest (C7, C8, and C9). Four to six soil cores (1.5 inch diameter) were taken in four 5m x 5m subplots located in the buffer zone adjacent to the experimental plot (Figure 1). The Oe and Oa layers and the top 10 cm of the mineral soil were sampled. Soil horizons were divided in the field and all samples from a single plot were composited. In 2010, soils were collected June 4-7, July 15-19, and August 9.
In the lab, soils were sorted to remove rocks and roots > ~1mm. Approximately 10 g organic soil and 20 g mineral soil were extracted with 100 ml 2M KCl within 24 hours of removal from the field to measure initial NH4+ and NO3- concentrations. A second subsample was incubated at room temperature for 14 days. After 14 days, the incubated samples were extracted in the same manner as the initial samples. Samples were analyzed for NH4+ and NO3- in the Fisk Lab at Miami University.
Results
In general, net N mineralization and net nitrification were highly variable. We treated the horizons as independent samples, and were able to discern some stand differences within horizons. For example, C7 had consistently high N mineralization in the B horizon, while C9 had consistently high N mineralization in the Oa horizon. There did not seem to be any consistent patterns in either N mineralization or nitrification relative to the timing of the samples (June vs. July vs. August; Figure 2).
To analyze the pre-treatment data, we used an ANOVA model with a randomized complete block design (stands were considered the blocking factor) to test for differences between months.
Net nitrification results for differences between months:
|
|
P value (a=0.05) |
Tukey’s HSD |
|
Oe |
Not sig. |
|
|
Oa |
Not sig. |
|
|
B |
0.005 |
June < July and August |
Net N mineralization results for differences between months:
|
|
P value (a=0.05) |
Tukey’s HSD |
|
Oe |
Not sig. |
|
|
Oa |
0.01 |
July < August |
|
B |
0.01 |
July < August |
We then removed the blocking factor to look for differences between stands, with plot as the replicate.
Net nitrification results for differences between stands:
|
|
P value (a=0.05) |
Tukey’s HSD |
|
Oe |
Not sig. |
|
|
Oa |
Not sig. |
|
|
B |
<0.0001 |
C9> C7 and C8 |
Net N mineralization results for differences between stands:
|
|
P value (a=0.05) |
Tukey’s HSD |
|
Oe |
0.05 |
C9 > C8 |
|
Oa |
Not sig. |
|
|
B |
Not sig. |
|
We also applied the future N and P treatment designations to the plots to look for pre-treatment patterns between the four treatments. There were no significant differences (a=0.05) between treatment types when treatments were blocked by stand (Figure 3).
Summary of Results
We were able to detect some differences in net nitrification and net N mineralization over the growing season. On average, net nitrification in the B horizon was 7.6 times higher in July than June, and 5.9 times higher in August than in June. Net N mineralization in the Oa horizon was twice as high in August as July, and the same pattern was observed the B horizon.
We also observed differences in net nitrification and net N mineralization by stand. Average net nitrification across the growing season in the B horizon was positive in C9 (0.007 gN/g dry soil/hr), but negative in C7 (-0.0003 gN/g dry soil/hr) and C8 (-5.1 x 10⁻⁵ gN/g dry soil/hr). Net N mineralization in the Oe horizon was 2.5 times greater in C9 than C8 across the growing season.
Finally, we did not observe any significant differences between the future fertilization treatments (N, P, NxP, control) when blocked by site, therefore we can be confident that treatment differences which we observe in future experiments will not be artifacts of preexisting differences between the randomly assigned treatments.