iTree Hydro Demonstrates Benefits of Green Infrastructure - Reduce Flooding and Pollutant Loading
 The iTree Hydro model simulations were able to represent the impact of green infrastructure on water resources, both the
volume and rate of runoff and the concentration and load of pollutants in the runoff. The methods we used to get these
simulations working are given below. Here we summarize the iTree simulation results. The iTree model computed the annual
runoff volume and pollutant load for a small urban watershed in Syracuse, NY using hourly weather data for the year 2010
for a base scenario where there was no green infrastructure. The runoff volume is divided into runoff through groundwater
(after infiltrating through the soil) and overland runoff from grass and impervious areas. The iTree model then computed
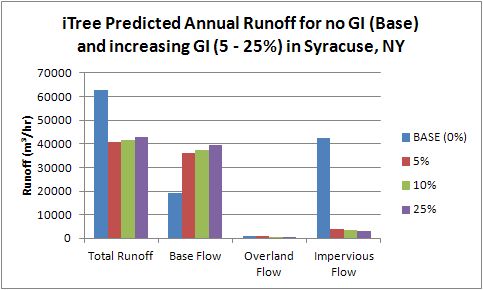
runoff volume (and pollutant load) for 3 other scenarios, each a larger percentage of green infrastructure. We simulated
5 to 25% of land cover converted to green infrastructure rain gardens. The figure below shows how total runoff for the
no green infrastructure (blue color) is about 25% higher than runoff for green infrastructure scenarios.
This finding is useful for urban watershed analysis, but even more important is the following sections where we explain how you can
conduct a similar study.
The iTree Hydro model simulations were able to represent the impact of green infrastructure on water resources, both the
volume and rate of runoff and the concentration and load of pollutants in the runoff. The methods we used to get these
simulations working are given below. Here we summarize the iTree simulation results. The iTree model computed the annual
runoff volume and pollutant load for a small urban watershed in Syracuse, NY using hourly weather data for the year 2010
for a base scenario where there was no green infrastructure. The runoff volume is divided into runoff through groundwater
(after infiltrating through the soil) and overland runoff from grass and impervious areas. The iTree model then computed
runoff volume (and pollutant load) for 3 other scenarios, each a larger percentage of green infrastructure. We simulated
5 to 25% of land cover converted to green infrastructure rain gardens. The figure below shows how total runoff for the
no green infrastructure (blue color) is about 25% higher than runoff for green infrastructure scenarios.
This finding is useful for urban watershed analysis, but even more important is the following sections where we explain how you can
conduct a similar study.
Download iTree Hydro and Simulate a Base Case
 Get iTree Hydro running. If you do not have iTree Hydro installed, you will need to download it at the
iTree Hydro website.
To download it the first time, you need to create an account. The
iTree Hydro Users Manual
explains how to set up, run, and potentially calibrate the model.
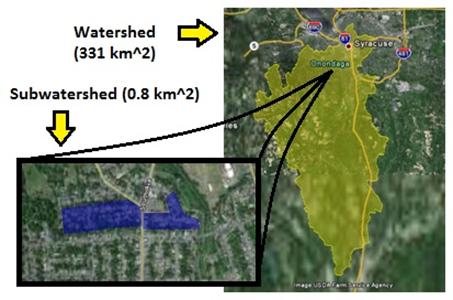
In this demonstration of using iTree Hydro for Green Infrastructure, we wanted to use a relatively small area, called a sewershed.
Before simulating green infrastructure with iTree Hydro on the sewershed, we ran and calibrated iTree Hydro for the larger watershed
that had a USGS real-time water data reporting the runoff.
This difference between watershed and sub-watershed (i.e., sewershed in blue) is illustrated by the graphic.
Get iTree Hydro running. If you do not have iTree Hydro installed, you will need to download it at the
iTree Hydro website.
To download it the first time, you need to create an account. The
iTree Hydro Users Manual
explains how to set up, run, and potentially calibrate the model.
In this demonstration of using iTree Hydro for Green Infrastructure, we wanted to use a relatively small area, called a sewershed.
Before simulating green infrastructure with iTree Hydro on the sewershed, we ran and calibrated iTree Hydro for the larger watershed
that had a USGS real-time water data reporting the runoff.
This difference between watershed and sub-watershed (i.e., sewershed in blue) is illustrated by the graphic.
Set the Initial Parameters
 To run iTree Hydro you need to set land cover and hydrology parameter values that describe your watershed or sewershed.
To do this we used remotely sensed land cover images (e.g., satellite NLCD) and processed them with a VBA code to extract the parameters.
To use this VBA extractor, click to open the
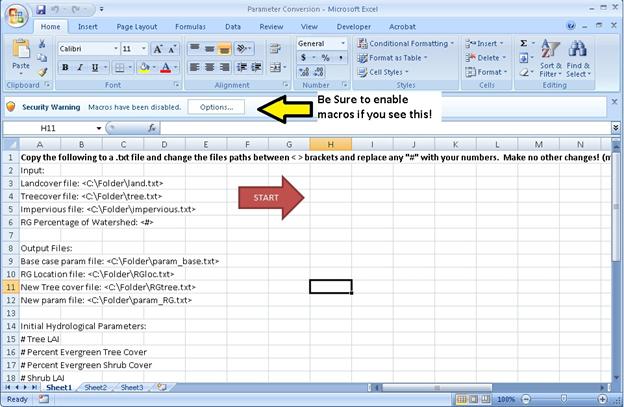
Excel VBA Parameter Conversion macro.
Note - you may need to enable macros to use it.
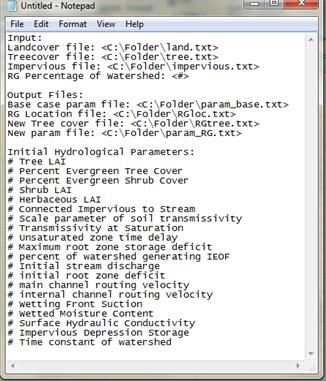
In the Workbook select the contents of Sheet1 cells A2 to A34 and copy and paste to a new .txt file in notepad (see graphic to right).
Copy the calibrated values from the Configuration window in iTree Hydro to the third section in the text file (Initial Hydrological Parameters).
You should do this by replacing the # before the label with the calibrated number. Make sure there is still a space between the number and the label.
Save this .txt file and note the full file path (e.g.: C:\Documents\filepar.txt). You will add the other information later.
Next we need to get elevation data to understand where our water flows.
To run iTree Hydro you need to set land cover and hydrology parameter values that describe your watershed or sewershed.
To do this we used remotely sensed land cover images (e.g., satellite NLCD) and processed them with a VBA code to extract the parameters.
To use this VBA extractor, click to open the
Excel VBA Parameter Conversion macro.
Note - you may need to enable macros to use it.
In the Workbook select the contents of Sheet1 cells A2 to A34 and copy and paste to a new .txt file in notepad (see graphic to right).
Copy the calibrated values from the Configuration window in iTree Hydro to the third section in the text file (Initial Hydrological Parameters).
You should do this by replacing the # before the label with the calibrated number. Make sure there is still a space between the number and the label.
Save this .txt file and note the full file path (e.g.: C:\Documents\filepar.txt). You will add the other information later.
Next we need to get elevation data to understand where our water flows.
Working with Digital Elevation Model (DEM) Data
Water movement is influenced by gravity, and by examining DEM data we can determine some basics about water movement. For the urban sewershed, we recommend a high-resolution DEM, such as ~1-2 m horizontal resolution and ~5 cm vertical accuracy data obtained by LiDAR. The Parameter Conversion macro is meant to work with 1-m spatial resolution data. This section requires some comfort with ESRI Arc GIS. If you use DEM data of a different spatial resolution, resample the raster image using ESRI ArcGIS or similar GIS software to a 1-meter cell size. Next, delineate the sewershed using the DEM and similar methods as described in the iTree Hydro Users Manual. Extract by mask for the area of your sewershed. Do not worry about finding the area of the sewershed, since it will be automatically generated when the grid is run through the macro. Using ESRI Arc GIS tools, convert the layer to an ASCII file and rename to .dat file format for input into iTree.
Working with Land Cover Data
To understand how water interacts with green infrastructure, we need to know the current land cover and then design some alternatives. Land cover data should be clipped to the sewershed area (auto-delineated) and classified. The Parameter Conversion macro currently uses land cover data collected in 2002 by the Emerge company. These data were obtained by an airborne multi-spectral 3-band color infrared sensor at 0.6m horizontal resolution. They were made available by the NASA-Arc at SUNY ESF. The data were classified to denote trees as 1, short vegetation as 2, bare soil as 3, water as 4 and impervious as 5. These data were resampled (and re-projected) to the correct same cell size used by the DEM before clipping to the sewershed area. The final step in preparing land cover is to convert the ArcGIS Grid file to an ASCII file.
Delineating Impervious and Tree Cover
Rainfall on impervious cover like rooftops, driveways, sidewalks, and roads typically goes directly into runoff or ponds and evaporates. Tree cover, by contrast, may have pervious ground beneath the canopy and rainfall (as drip or throughfall) has the chance to infiltrate into the soil. Rain intercepted by leaves may later evaporate, and soil water may contribute to tree transpiration or direct evaporation. Impervious and tree cover should be manually delineated for the sewershed to get the best accuracy for your iTree Hydro model simulation. You delineate impervious cover by ground surveys or by tracing the areas in ArcGIS using heads-up digitizing. To trace it in GIS, you may need two aerial images—a leaf-on and a leaf-off. Leaf-on images can be obtained from USDA-NRCS's Geospatial Data Gateway. Choose the Interactive map link on the right hand side of the USDA-NRCS page and select the area you want, leaving border room so you will not cut any part of your sewershed off. Accept the area and select the most recent [National Ag. Imagery Program Mosaic] under the Ortho Imagery heading. Aerial images are usually taken during leaf-off times, and so can be obtained from most online aerial image sources, such as the New York State GIS Clearinghouse. Add these data layers to ArcGIS and project to the proper coordinate system (same used in DEM and the rest of the layers). Cell size does not have to be the same, although make sure you can make out distinct shapes and tell what is impervious and what is a tree.Follow these instructions to make the impervious and tree cover layers:
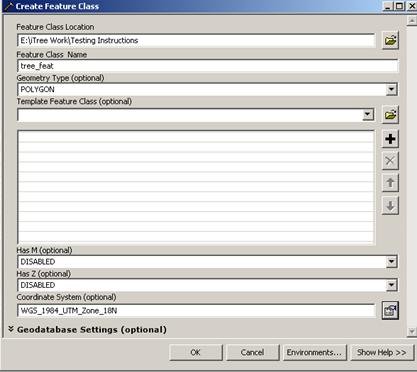
- Create a feature class (Data Management Tools - Feature Class - Create Feature Class) with the same coordinate system as the DEM. You can select the [Import] option when you chose your coordinate system at the bottom of the window when you are making the feature class. This ensures it is the same. Open the feature class for editing using the editing toolbar.
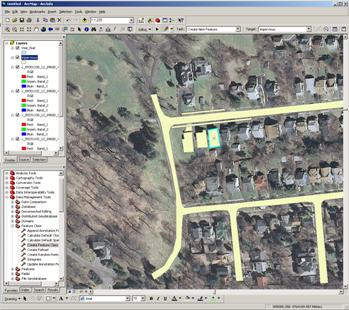
- With the leaf-off image showing as the top-most layer, trace any areas that are impervious with polygons (using the [create new feature] option). The main ones to be looking for are houses, sidewalks, roads, and parking lots. It is a good idea to go slightly beyond the bounds of your subwatershed so you do not have to go back and edit again later.
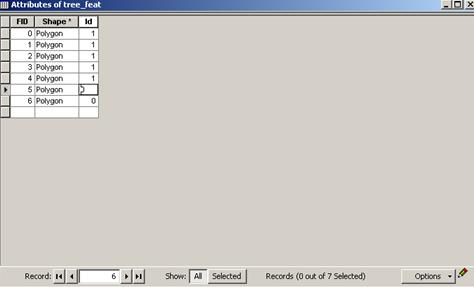
- Go into the attribute table and make sure all the [Id] numbers are [1] (see below). After you have finished adding all the impervious areas and changed the Id numbers to 1, save your edits and stop editing.
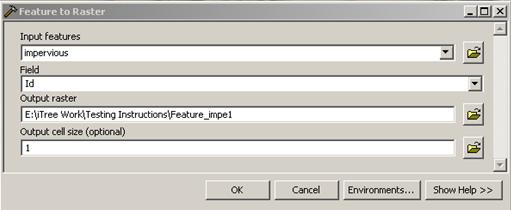
- Convert the feature layer to a raster (Conversion Tools Feature to Raster, see below), making sure the cell size is 1 meter (it will automatically chose some fraction of the extent by default to be the cell size). Make sure it says [Id] under the Field option.
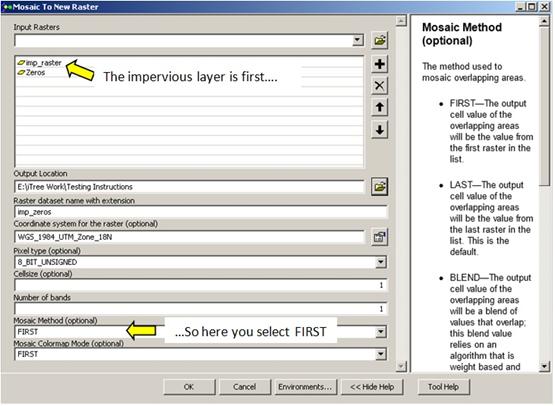
- You will want a [background] value of zero for areas that are in the watershed but not impervious. Multiply the DEM raster layer by zero (Spatial Analyst Tools Math Times) then create a mosaic with the [zero] layer and the impervious layer (Data Management Tools Raster Dataset Mosaic to New Raster). Make sure you select the method that will ensure the impervious layer values are chosen over the zero values (either FIRST option or LAST option, depending on the order you put the layer in), as well as the proper cell size and coordinate system (see below).
- Extract the impervious layer with the zeros background so that it is the same extent as the DEM and land cover layers you extracted. Convert to an ASCII file.
- Repeat steps 1 through 6 to create the tree cover layer, only use the leaf-on image as background and trace trees instead of impervious surfaces.
Specify the File Paths for the Simulation
Time to link the model to your files created above. Now that you have all the input files you need, enter their file paths into the [filepar.txt] file created earlier. You should only replace the sample file paths between the brackets and change nothing else. Enter the percent of the sewershed you wish to be converted to rain gardens by replacing the # between brackets in the first section with the number. For example, to simulate 10% of the watershed as rain gardens, it should read [ watershed: <10>]. This should be less than the percent of the watershed that is pervious (usually no more than 50%) and something that is reasonably attainable but significant (somewhere between 5% and 25% is suggested). Also enter valid file paths for the 4 output files. Only the parameter files are ones you will be using in your comparison, but the tree and rain garden files may be interesting to look at is you want to see how the watershed was modified for the hypothetical addition of rain gardens. Regardless, they have to be 4 distinct file names in existing folders.
Specify the Soil Parameters for the Simulation
Soil physical properties influence the rate rainfall infiltrates into the soil. Typically physical properties are estimated based on soil texture. Look at the soil parameters called: saturated soil transmissivity, wetting front suction, surface hydraulic conductivity, and wetted moisture content. These parameters can be set based on determining soil texture class for your sewershed. You can use the Web Soil Survey. The table below has values typical for different soil textures. It is suggested that clay loam or a closely related texture is used for most urban fill areas. The values for a sand texture is factored in when simulating the addition of rain gardens. The soil transmissivity is the product of depth and hydraulic conductivity for the deep saturated layer. Consider using a lower hydraulic conductivity to compute this. The surface hydraulic conductivity is for the upper soil layer. Change these four values in the filepar.txt file, save all changes, and you are ready to run the Parameter Conversion macro. Typical Soil Parameter Values for some Sand and Clay Textures; (Adapted from Wurbs and James, Water Resources Engineering, pg 484.)| Soil Texture | Wetted Moisture Content (m) | Wetting Front Suction (m) | Hydraulic Conductivity (m/hr) |
| Sand | 0.437 | 0.0495 | 0.1178 |
| Clay Loam | 0.464 | 0.2088 | 0.0010 |
| Silty Clay | 0.479 | 0.2922 | 0.0005 |
| Clay | 0.475 | 0.3163 | 0.0003 |
Running the Parameter Conversion Macro
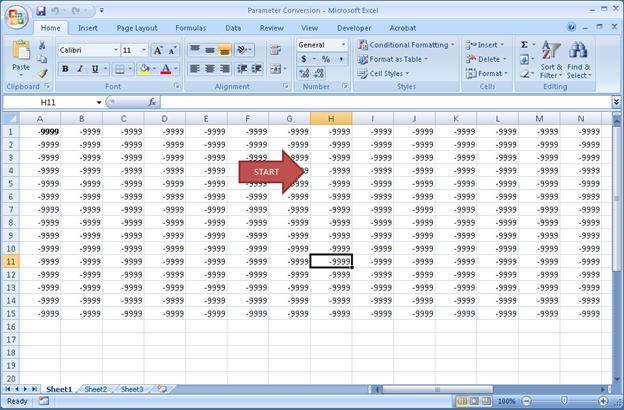
Open [Parameter Conversion.xlsm] and make sure macros are enabled (click [Options] button if you see the Security Warning above the formula bar and click [Enable this content]). If everything in the filepar.txt file is ready to go, click the red START arrow (see top screen shot, below). You will be asked to enter the location of the filepar.txt file. The macro may take several minutes to run, depending on the sewershed size. If it is having trouble fitting the requested percentage of rain gardens, a notification will come up asking permission to continue filling the pervious areas non-discriminatively, so keep an eye on it if you think you are close to the max. You will see numbers changing on the screen (see bottom screen shot, below), but when it is done it will return to the same as when you opened it. It is going through a lot of numbers so try to be patient, even if it occasionally says it is [Not Responding] because it will work through it eventually.