Faculty Profile
Avik Chatterjee


Associate Professor
220 Jahn Lab
Research and Scholarship
Ph.D., 1996, Cornell University; Postdoctoral Associate, 1996-1998, University of Illinois at Urbana-Champaign; Postdoctoral Associate, 1998-1999, Institute of Physical Science and Technology, University of Maryland at College Park.
Percolation by Nanoparticles:
Dr. Chatterjee’s efforts focus on understanding the formation of networks of connected particles (“percolation”). These particles can have different shapes ranging from elongated rods to flattened disks (representing, for example, carbon nanotubes or graphene or clay platelets, respectively). The concentration at which there emerges a physically connected network capable of transmitting electrical current or bearing mechanical stress is referred to as the percolation threshold. This key concentration varies greatly as a function of the shapes and sizes of the particles, how they are distributed in the embedding medium, and also with the criterion used for deciding when a pair of objects are said to be “connected”. These dependences are examined within an analogy to discrete lattice-based models that assign a central role to the average number of contacts that a representative particle experiences with its neighbors.
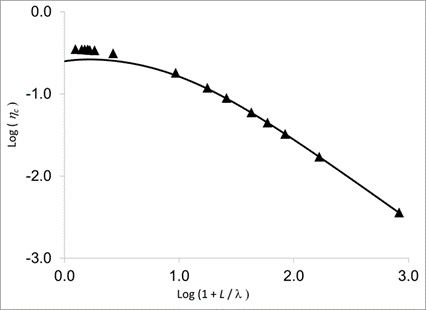
For example, the figure below compares percolation thresholds for random, isotropic spherocylinders as a function of the aspect ratio calculated from (i) our theory (solid line: “Connectedness percolation in isotropic systems of monodisperse spherocylinders”, A.P. Chatterjee, J. Phys.: Condensed Matter, 27, 375302, (2015)), with: (ii) results from Monte Carlo simulations (filled triangles: “Percolation in suspensions of hard nanoparticles: From spheres to needles”, T. Schilling, M.A. Miller, and P. van der Schoot, Europhys. Lett., 111, 56004, (2015)).
Percolation by Fractal Aggregates:
More recently this approach has been generalized to examine percolation by fractal aggregates comprised of numerous smaller spherical “primary particles”. The fractal dimension (denoted dF) of an aggregate can vary from 3 (three) for a dense three-dimensional object (such as a sphere), to 1 (unity) for a linear rod-like assembly, and structures of varying internal porosity or compactness in between:
Our work suggests that the volume fraction at the percolation threshold may show a minimum as a function of the fractal dimension if other variables (such as the overall sizes of individual aggregates) are held fixed: “Percolation Thresholds for Spherically Symmetric Fractal Aggregates”, A.P. Chatterjee, J. Stat. Phys., vol. 190, 113, 150, (2023):
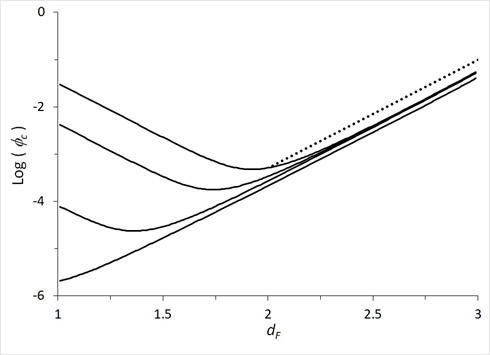
The various curves in the above figure represent different choices for the distance over which pairs of subunits are considered “connected”. The percolation threshold shows a minimum at intermediate values of dF that moves towards smaller value of the fractal dimension and eventually disappears as the connectedness range is increased.
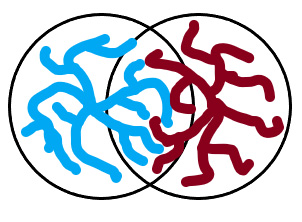
This minimum concentration (at dF ˜ 1.5 - 2) arises because: (i) dense and compact aggregates form contacts as soon as they touch each other tangentially, but: (ii) more tenuous objects must interpenetrate more deeply before contacts appear between their subunits. We model these effects by treating the subunits that comprise each object as a smeared-out “cloud” of points and estimating how many contacts might result depending on the degree of interpenetration:
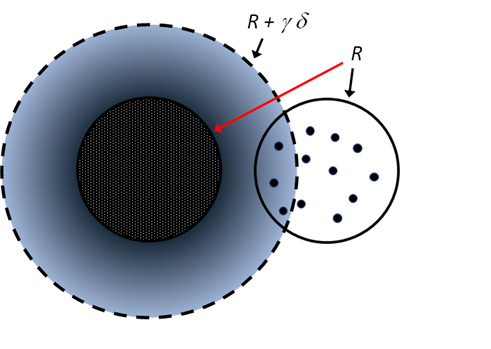
The schematic image shows a pair of interpenetrating fractal aggregates, each of radius R, where γδ denotes the separation within which a pair of subunits are defined as being “connected”. For one aggregate the subunits are shown as a cloud of density while for the other the center of each subunit is represented by a point. Contact numbers are estimated from the overlaps between these points and the cloud of density.
Selected Publications
Selected Publications:
“Percolation Thresholds for Spherically Symmetric Fractal Aggregates”, A.P. Chatterjee, J. Stat. Phys., vol. 190, 113, (2023).
“Geometric Percolation of Spherically Symmetric Fractal Aggregates”, A.P. Chatterjee and C. Grimaldi, J. Stat. Phys., vol. 188, 29, (2022).
“Bethe lattice model with site and bond correlations for continuum percolation by isotropic systems of monodisperse rods”, A.P. Chatterjee, Phys. Rev. E, 96, 022142, (2017).
“Tunneling conductivity in anisotropic nanofiber composites: a percolation-based model”, A.P. Chatterjee and C. Grimaldi, J. Phys.: Condensed Matter, 27, 145302, (2015).
“Quasiuniversal connectedness percolation of polydisperse rod systems”, B. Nigro, C. Grimaldi, P. Ryser, A.P. Chatterjee, and P. van der Schoot, Phys. Rev. Letters, 110, 015701, (2013).
- Full list of Publications (Google Scholar)
Teaching
Courses Taught:
FCH 360: Physical Chemistry I
FCH 361: Physical Chemistry II
FCH 650: Statistical Physics & Chemistry of Macromolecules
- Blackboard website for classes (log-in required)