New York View
Genesee River

Quantifying change in riparian vegetation in the Genesee River and exploring relationship to seasonal weather patterns and downstream water quality
- Final report (PDF)
- Project Tool: NDVI and EVI explorer
- Publication in Journal of the American Water Resources Association
- Project data for both channel boundary and classified riparian vegetation
- Google Earth Engine project code part1 (vegetation classification) and part2 (vegetation index extraction) (requires GEE account).
The Great Lakes are the largest body of freshwater in the world. They contain more than 20% of the earth’s surface freshwater and 95% of the surface freshwater in the United States. Despite their importance, the Great Lakes and their broader basin have been significantly degraded by human activities over the past two centuries. Riparian vegetation have a significant role in filtering contamination and maintaining water quality. Under stress from climate change, agricultural practices and urbanization, the extent of buffers in many areas is decreasing and will remain under pressure with continued economic revitalization plans.
This database was produced to present the outcomes of a research project conducted by Dr. Lindi Quackenbush and Ge Pu at SUNY-ESF to explore quantification of the relations between riparian vegetation, local weather patterns and stream water quality in the Great Lakes basin, with a particular focus on the Genesee River as it flows into Lake Ontario. A copy of the final project report can be found here.
This database consists of:
- Riparian Vegetation Extent and Density Data.
- Temperature and Precipitation Data.
- Water Quality Data.
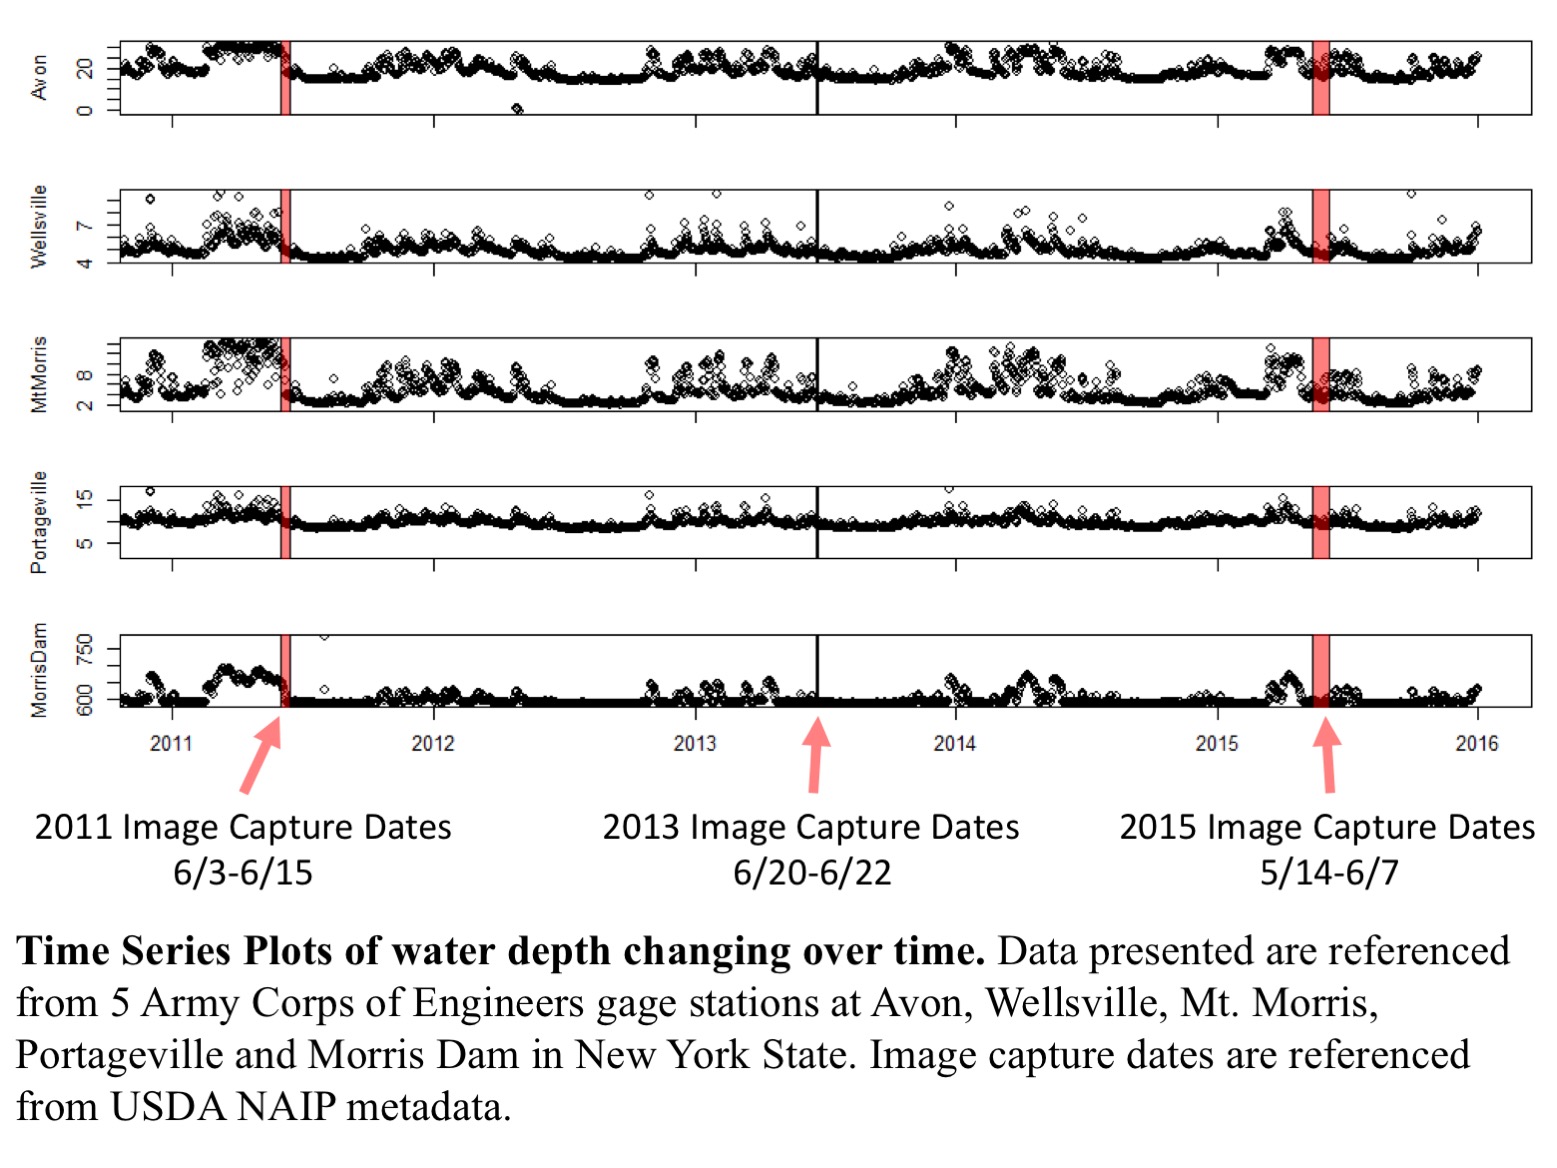
- River Gage Data.
Please see how each data were produced/referenced in the Project Metadata.
- This project was generously funded by an AmericaView Mini Grant and SUNY-ESF. AmericaView is funded primarily by a grant from the U.S. Geological Survey to advance the widespread use of remote sensing data and technology through education and outreach, workforce development, applied research, and technology transfer to the public and private sectors.
- We would also like to thank Google Earth Engine development team for granting access and providing assistance in using such a wonderful remote sensing and GIS data processing and archiving platform.
- Reference data used in this project were provided by United States Geological Survey (USGS), National Oceanic and Atmospheric Administration (NOAA) and US Army Corps of Engineers (USACE).
Project Metadata
This study focuses on the main stem of the Genesee River, which flows from Gold, PA to Rochester, NY with a total length of 247 km and 6407.6 km2 watershed area before discharging into Lake Ontario. Land cover in the area is dominated by agriculture (52%), and forest area (40%), with smaller amounts of developed land (4.6%), wetlands and water (2%), and other non- developed lands (1.4%) (Makarewicz et al. 2015). Parts of the Genesee River are currently listed as impaired on the most recent Section 303 (d) list of the Federal Clean Water Act due to a range of issues including phosphorus, sedimentation, oxygen demand, and pathogen presence (NYSDEC 2014). Riparian buffers along the Genesee River play a significant role in improving the overall condition of the river and help combat many downstream water quality problems through filtering contamination and trapping sedimentation.
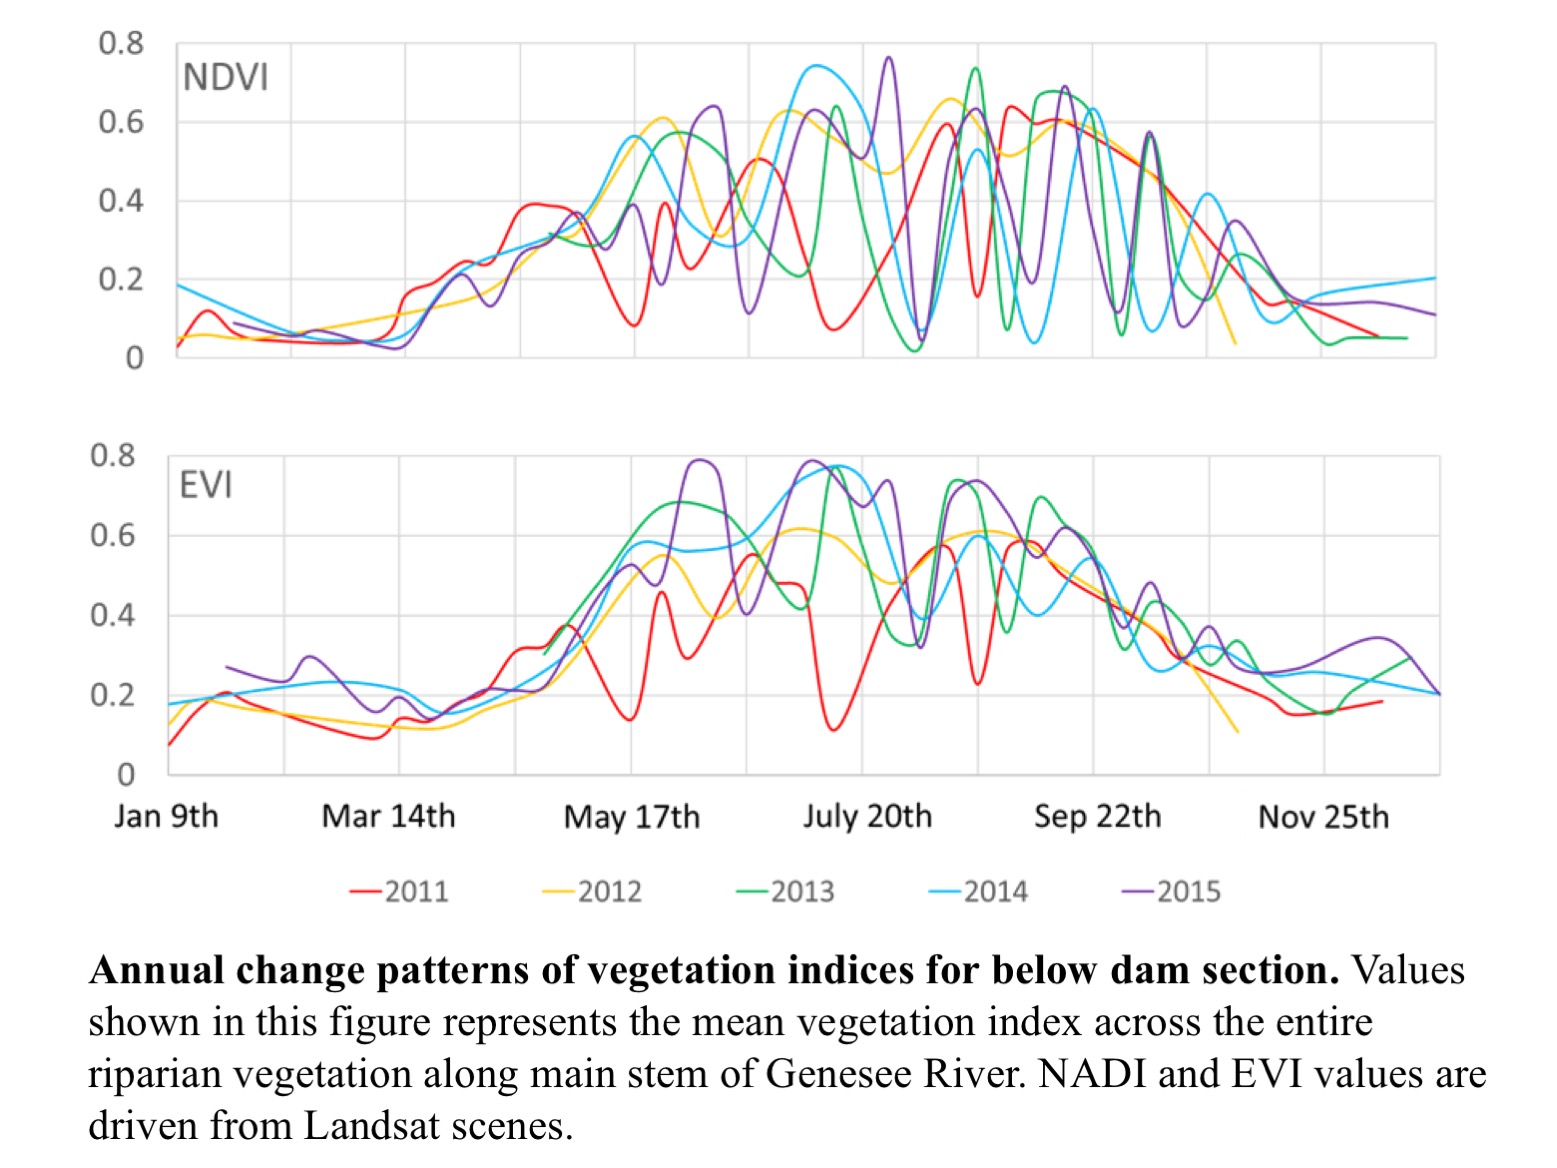
In performing the analysis for this project, the watershed was divided based on the presence of a gravity dam on the Genesee River. This dam was used as a separation point when comparing the results of riparian vegetation indices. This separation was done primarily because upstream of the dam is a natural channel while downstream of the dam is sedimentation limited and channelized in places.
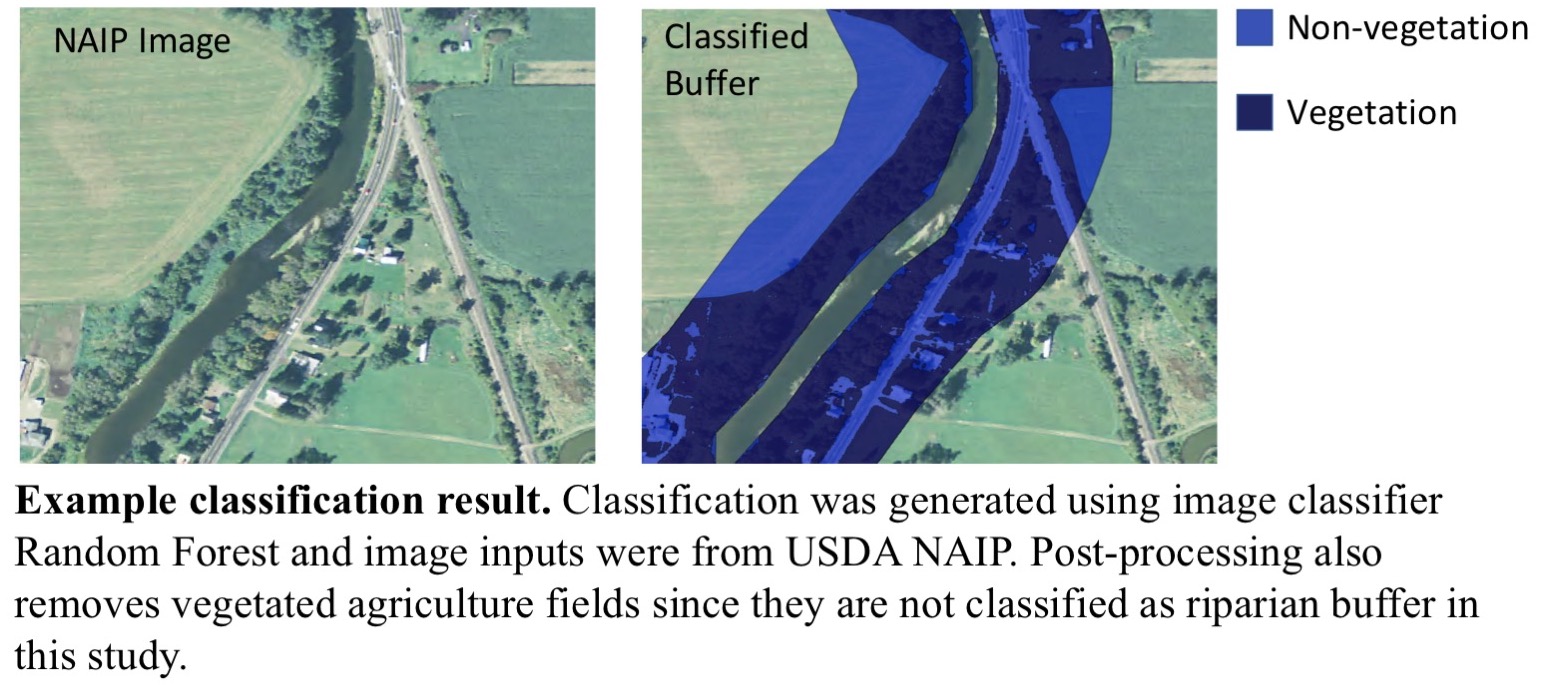
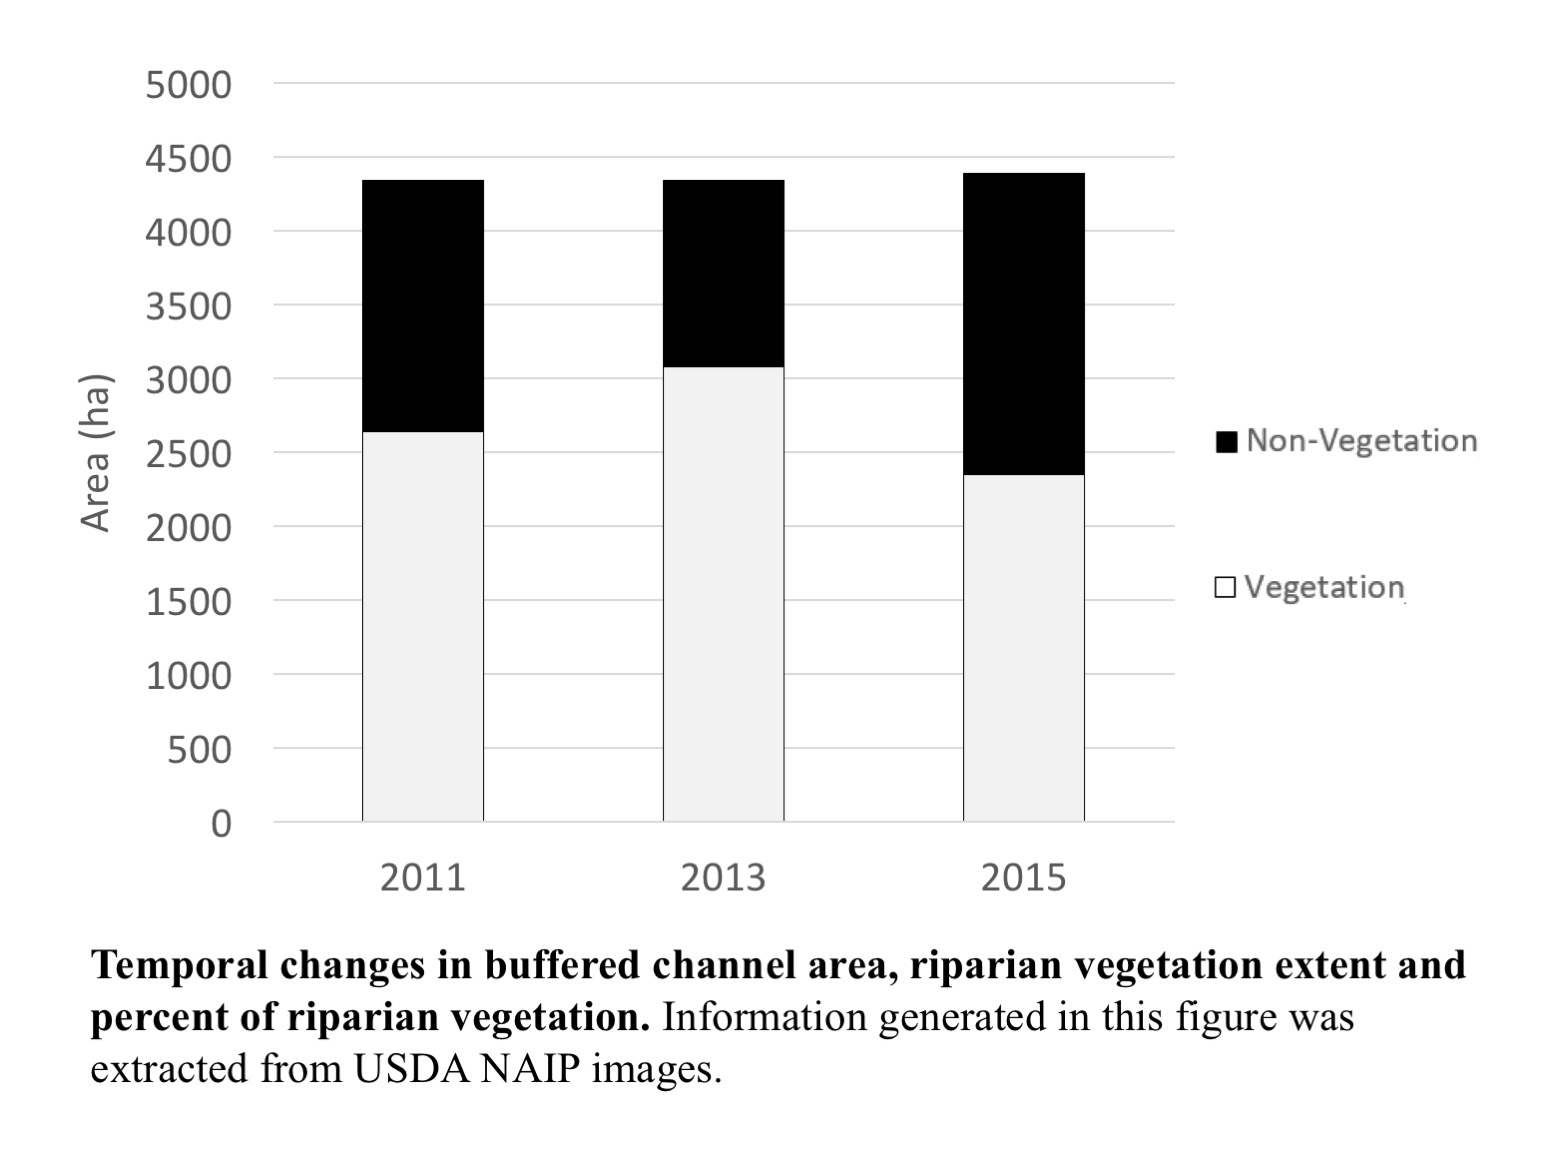
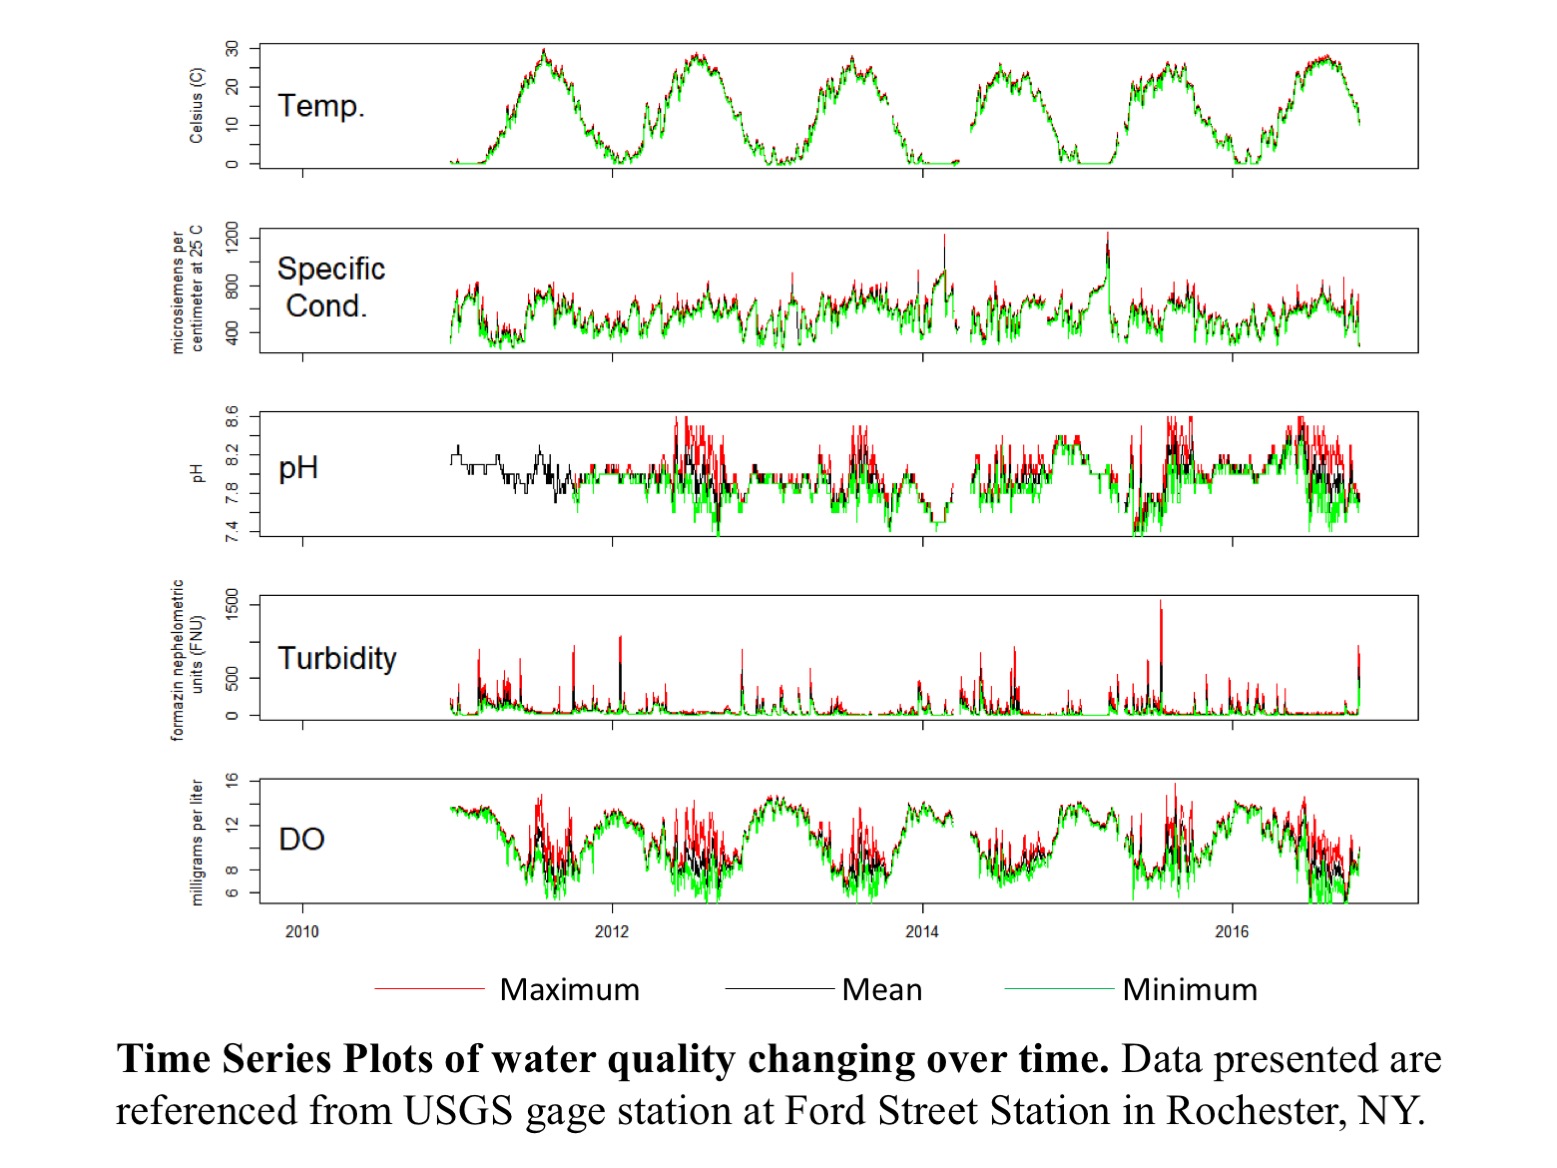
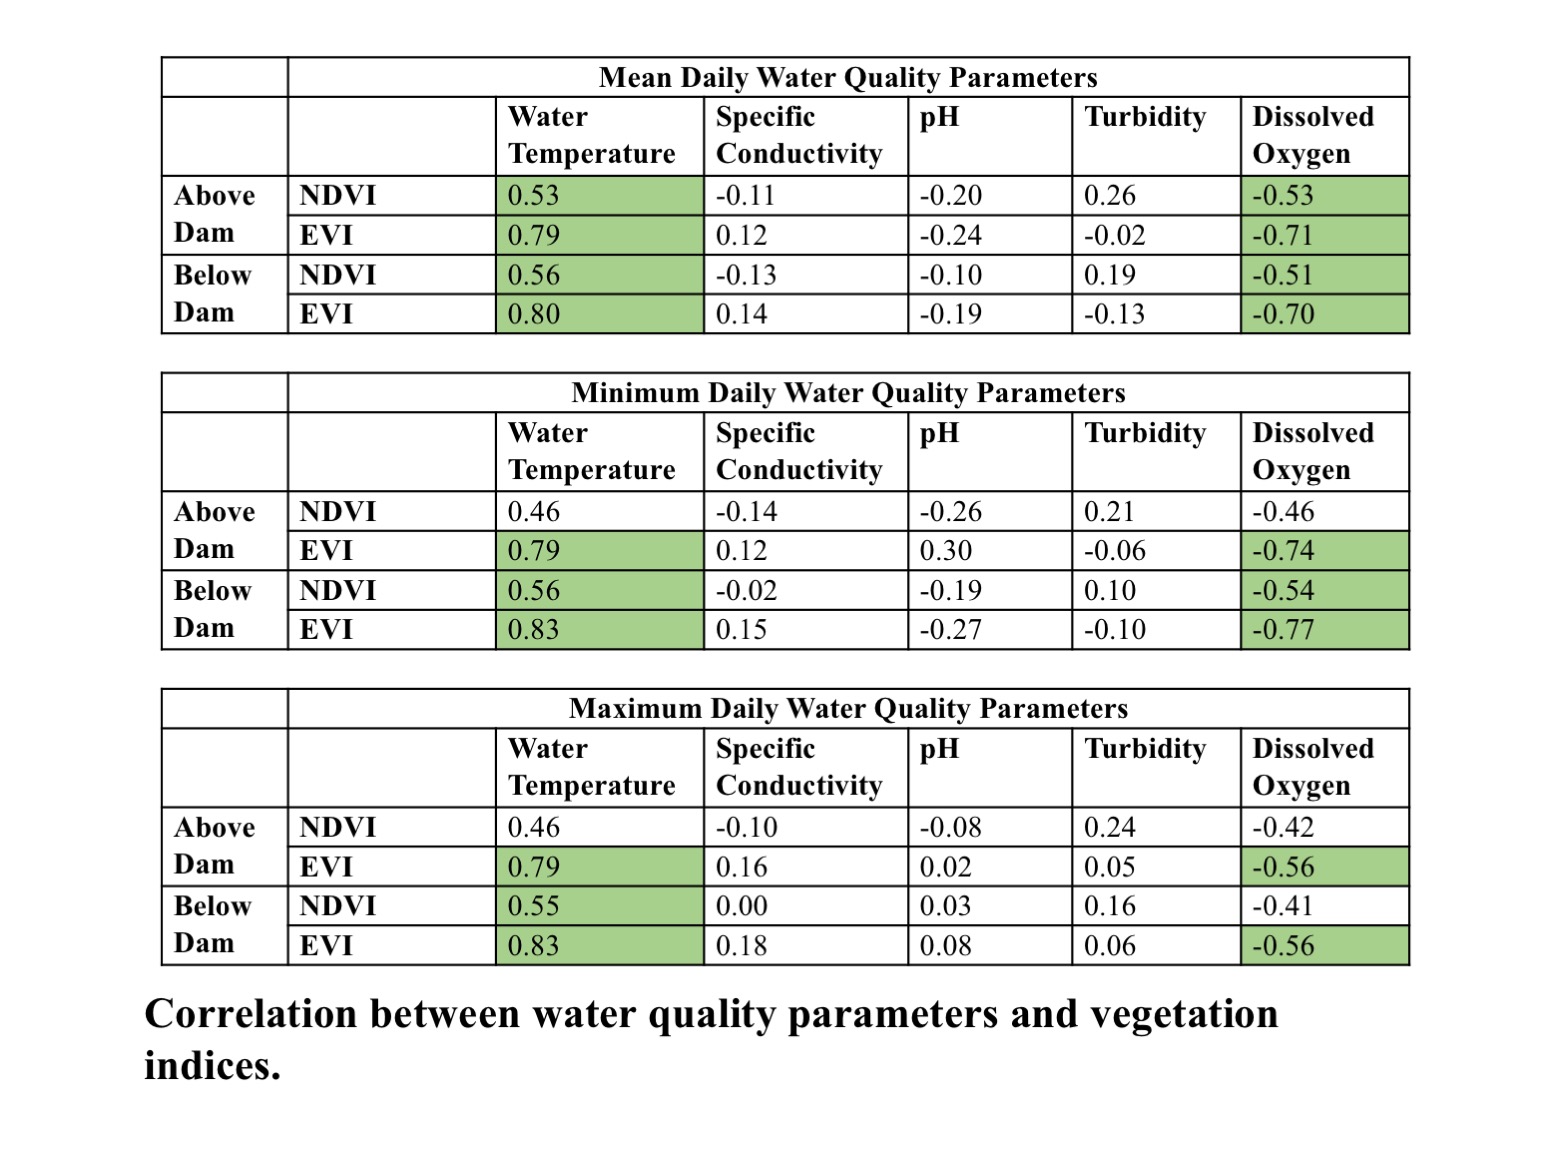
Project Results